As a quantitative trading researcher proficient in the Wyckoff Method, I will prepare a comprehensive and in-depth quantitative analysis report based on the BTCUSDT data (from 2025-12-17 to 2026-02-15) and its historical ranking indicators provided. All conclusions are strictly derived from data and the Wyckoff volume-price principles.
BTCUSDT Wyckoff Volume-Price Analysis Report
Product Code: BTCUSDT
Analysis Period: 2025-12-17 to 2026-02-15
Report Generation Date: 2026-02-16
1. Trend Analysis & Market Phase Identification
As of February 15, 2026, the underlying asset BTCUSDT opened at 69822.94, closed at 68484.00, with the 5-day moving average at 68174.58, 10-day MA at 68412.08, and 20-day MA at 75165.62. The daily change was -1.92%, weekly change -2.63%, monthly change -13.03%, quarterly change -21.86%, and yearly change -21.86%.

- 1. Trend Structure Evolution:
- • Initial Phase (2025-12-17 to 2026-01-15): Price attempted to build a base through consolidation and then initiated a rally. The price rebounded from a low of approximately97,924 on January 14. During this period, the price successfully moved above all short-term moving averages (MA_5D, MA_10D, MA_20D), forming a bullish alignment that confirmed the intermediate-term uptrend.
- • Trend Exhaustion & Reversal (2026-01-15 to 2026-01-31): After reaching the high, the price failed to sustain the advance, experiencing a sharp single-day decline of -4.54% on January 20, followed by continued downward movement. A critical signal occurred on January 29, where the price broke below the lower boundary of the previous consolidation platform (around $87,000) on heavy volume (
VOLUME_AVG_60D_RATIO= 2.06), subsequently falling below MA_20D and MA_30D, signaling the end of the uptrend. - • Accelerated Decline & Panic (2026-01-31 to 2026-02-05): Price entered a steep downward channel. A severe drop of -6.55% occurred on January 31, followed by persistent declines in early February, reaching a low of $62,345 on February 5. During this stage, the price remained below all major moving averages (MA_5D, MA_10D, MA_20D, MA_30D, MA_60D), forming a clear bearish alignment. Notably, MA_60D (the long-term trend line) began to turn downward in early February, confirming the risk of a long-term uptrend reversal.
- 2. Moving Average Crossover Signals:
- • Bearish Crossover Confirmation: During the decline from late January to early February, MA_5D successively crossed below MA_10D, MA_20D, and MA_30D, forming a series of bearish death crosses, providing continuous technical confirmation of the downtrend.
- 3. Wyckoff Market Phase Assessment:
Based on price action and volume analysis, the current market (at the end of the analysis period) is likely transitioning from the "Panic (or Selling Climax)" phase to the "Initial Support/Automatic Rally" phase.- • Distribution: Occurred in mid-January 2026. Price showed signs of stalling at high levels (97,000) (e.g., January 15, 16), with volume remaining high but price struggling to advance, consistent with distribution characteristics.
- • Markdown: The decline beginning on January 20, initially with volume, later (January 25-31) exhibiting characteristics of an accelerated decline.
- • Panic / Selling Climax: February 5, 2026, is a typical climax day. The price plummeted -14.02% in a single day, with volume surging to 6.43 times its 60-day average (historical rank #2), and the RSI dropping to 15.82 (historical rank #8). All features point to extreme panic and liquidation in market sentiment.
- • Initial Support / Automatic Rally: The day after the panic (February 6), the market experienced a significant rebound (+12.19%), with volume still at an extremely high level (5.12 times the 60-day average). This aligns with the "Automatic Rally" that follows a panic sell-off in Wyckoff theory, typically driven by short covering and some bottom-fishing capital.
2. Volume-Price Relationship & Supply-Demand Dynamics
As of February 15, 2026, the underlying asset BTCUSDT opened at 69822.94, closed at 68484.00, volume was 20978.61, daily change -1.92%, volume 20978.61, 7-day average volume 23185.19, 7-day volume ratio 0.90.

- 1. Key Day Analysis (Demand vs. Supply):
- • High-Volume Advance (Demand Dominant):
- • 2026-01-13: Price increased by 4.51%, volume was 1.91 times the 21-day average (
VOLUME_AVG_21D_RATIO), indicating strong demand inflow. - • 2026-01-14: Price increased by 1.61%, volume was 1.83 times the 21-day average, demand continued.
- • 2026-02-06: Price rebounded 12.19% from the panic low, volume was 5.12 times the 60-day average. This is a critical signal: a massive-volume rebound following an extreme crash indicates significant capital absorption at low levels (emergence of demand), potentially signaling the exhaustion of panic sentiment.
- • 2026-01-13: Price increased by 4.51%, volume was 1.91 times the 21-day average (
- • High-Volume Stalling/Decline (Supply Dominant):
- • 2026-01-20: Price fell sharply by -4.54%, volume was 1.65 times the 21-day average. Supply overwhelmed demand, accelerating the downtrend.
- • 2026-01-29: Price fell sharply by -5.21%, volume was 2.06 times the 60-day average. Breaking below a key platform with strong supply pressure.
- • 2026-02-05 (Panic Day): Price crashed -14.02%, volume was 6.43 times the 60-day average (historical extreme). This represents the extreme release of supply (panic selling).
- • Low-Volume Rebound (Insufficient Demand):
- • January 24, 27, 28, 2026: Price showed minor rebounds or consolidation, but
VOLUME_AVG_7D_RATIOwas below 1 (0.32-0.96), indicating the rebound lacked follow-through demand, forming continuation patterns within the downtrend.
- • January 24, 27, 28, 2026: Price showed minor rebounds or consolidation, but
- • Extremely Low Volume (Liquidity Drying Up):
- • January 10, 17, 2026: Volume was only 0.16x and 0.24x the 60-day average, respectively (historical ranks #13, #16), occurring during the decline and at relatively high levels, indicating low market interest and declining liquidity.
- • High-Volume Advance (Demand Dominant):
- 2. Supply-Demand Power Shift Assessment:
Data clearly shows that supply completely dominated the market from late January to early February, peaking on February 5. The massive-volume rebound on February 6 is the first significant counterattack signal from demand. However, in subsequent trading days (February 7-15), volume significantly contracted (VOLUME_AVG_60D_RATIOfell back to around 1.0), and the price rebound was resisted near the $70,000 level. This indicates that demand failed to sustain and expand its gains after the initial counterattack, and the market entered a consolidation phase of tug-of-war between bulls and bears. The current supply-demand balance is fragile, but panic-driven supply has been cleared out to a certain extent.
3. Volatility & Market Sentiment
As of February 15, 2026, the underlying asset BTCUSDT opened at 69822.94, 7-day intraday volatility (Parkinson) 0.51, 7-day Parkinson volatility ratio 0.63, 7-day historical volatility 0.43, 7-day historical volatility ratio 0.40, RSI 35.70.

- 1. Volatility Levels & Changes:
- • Volatility Surge: Starting from late January, short-term volatility metrics (
HIS_VOLA_7D,PARKINSON_VOL_7D) rapidly increased. By February 6,HIS_VOLA_7Dreached an astonishing 155.77%, andPARKINSON_VOL_7Dreached 116.14%. - • Abnormal Volatility Structure: Short-term volatility far exceeded long-term volatility, forming an extremely steep volatility term structure. For example, on February 6,
HIS_VOLA_RATIO_7D_60Dreached 2.58 (nearly a 10-year rank #8), andPARKINSON_RATIO_7D_60Dreached 2.69 (nearly a 10-year rank #12). This clearly identifies the market being in a state of extreme instability and panic. - • Volatility Convergence: Since the panic peak on February 6, short-term volatility (7D) has begun to retreat from extreme highs, while long-term volatility (60D) is still rising. This aligns with the typical pattern following a panic event: the peak of short-term emotional shock has passed, but long-term market uncertainty has increased.
- • Volatility Surge: Starting from late January, short-term volatility metrics (
- 2. Sentiment Indicator (RSI):
- • Extreme Oversold Confirmation: RSI_14 dropped to 15.82 on February 5, marking the 8th lowest oversold reading in nearly a decade. This resonated with the high-volume crash, technically confirming the "panic" extreme in sentiment.
- • Rebound & Repair: RSI subsequently rebounded from the extreme oversold zone to the 30-35 range but remains in weak territory. This indicates that while market sentiment has repaired somewhat, overall weakness persists, and it has not entered a healthy bullish zone.
4. Relative Strength & Momentum Performance
- 1. Periodic Return Analysis:
- • Short-Term Momentum (WTD/MTD): As of February 15, the weekly-to-date (WTD) return is -2.63%, and the month-to-date (MTD) return is -13.03%. Short-term momentum is significantly negative, within a downtrend.
- • Medium to Long-Term Momentum (QTD/YTD): The quarter-to-date (QTD) return is -21.86%, and the year-to-date (YTD) return is -21.86%. Medium to long-term momentum has turned entirely negative, indicating the dominant trend since the beginning of the year has been downward.
- • Momentum Inflection Point: January saw significant positive momentum (MTD reached a high of +10.61% on January 14), but it failed to sustain and rapidly reversed. This corroborates the "Distribution - Markdown" phase transition identified in the trend analysis.
- 2. Momentum & Volume-Price Validation:
The negative momentum trend perfectly aligns with the volume-price structure of "high-volume declines and low-volume rebounds," confirming the validity and strength of the downtrend. The strong positive momentum (+12.19%) on February 6, combined with massive volume, constitutes the first noteworthy momentum reversal attempt within the downtrend.
5. Large Investor (Smart Money) Behavior Identification
Based on the interpretation of volume-price data using Wyckoff principles:
- 1. Distribution Activity: Inferred to have occurred in mid-to-early January (approximately in the97,000 zone). Price stalled after making new highs, accompanied by sustained high volume (e.g., January 13-15). This aligns with the characteristic of "smart money" distributing holdings to the chasing public at high levels.
- 2. Creating Panic & Absorption Activity: Core inference points to the period around February 5-6.
- • The massive-volume crash on February 5 (historically high volume) is a classic "Panic" or "Selling Climax." Public investors sell indiscriminately out of fear.
- • Who Was Buying? Such immense selling pressure requires an equal amount of buying to be absorbed. Wyckoff theory posits that this is precisely the time when "smart money" or large institutions secretly absorb shares amidst the panic. The even larger-volume rebound on February 6 further confirms that a powerful demand force intervened at low levels, not only absorbing the panic selling but also actively pushing prices higher.
- 3. Current Behavior: The post-panic rebound encountered resistance near $70,000 with contracting volume. This may indicate:
- • "Smart money" has completed initial absorption, temporarily halting large-scale buying and shifting to a wait-and-see approach to test the market's natural supply-demand conditions.
- • The market is entering a "Secondary Test (ST)" phase, where the price may decline again to test the support strength of the panic low area ($62,345). If, at that time, there is low-volume decline or decline on weak volume, it would further strengthen the validity of the potential bottom formation.
6. Support/Resistance Level Analysis & Trading Signals

- 1. Key Price Levels:
- • Strong Support Levels:
- • S1:63,000 zone. This is the low area formed by the panic selling on February 5, accompanied by historically high volume. It constitutes the recent "panic bottom" and the first strong support.
- • S2:60,000 zone (psychological and technical support). The next key area if S1 fails.
- • Key Resistance Levels:
- • R1:70,000 zone. The area where multiple rebound highs clustered between February 7-15, also the exhaustion area of the automatic rally post-panic. Breaking above this zone is the first signal of a moderating downtrend.
- • R2:73,000 zone. The low of a minor platform during the early February decline, now acting as resistance.
- • R3:80,000 zone. The lower boundary of the dense trading range from late January, serving as a critical bull-bear demarcation line.
- • Strong Support Levels:
- 2. Comprehensive Trading Signals & Operational Recommendations:
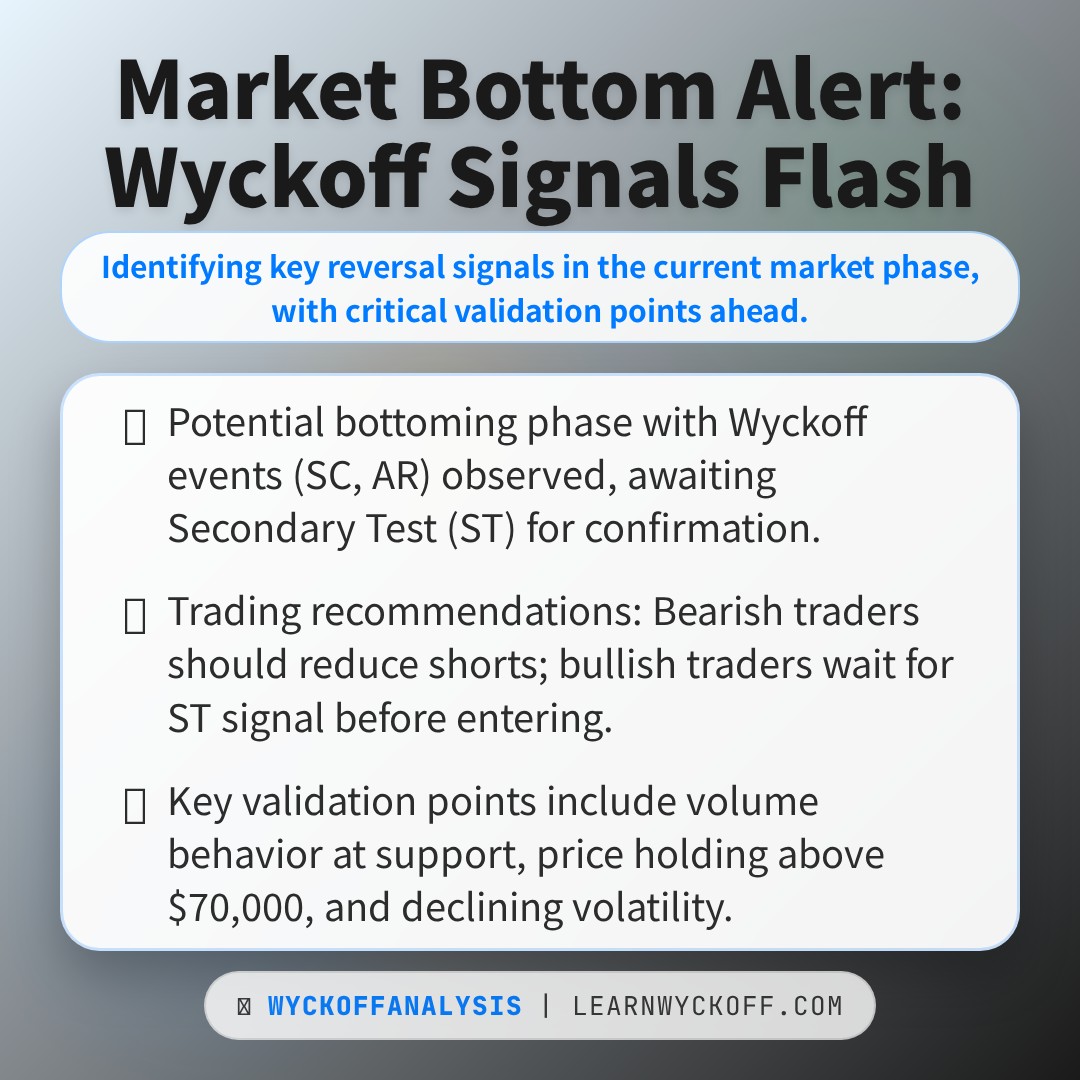
- • Trend Status: The primary trend is downward, but significant panic selling and preliminary demand counterattack signals have emerged. The market may be entering a bottoming attempt phase.
- • Wyckoff Events: A potential combination of a "Selling Climax (SC)" and an "Automatic Rally (AR)" has appeared. The market is awaiting a "Secondary Test (ST)" to validate the effectiveness of the bottom structure.
- • Operational Recommendations:
- • For Trend Traders (Bearish): The primary bearish trend may be in its final stages. It is recommended to move stop-losses below recent highs (e.g., above $72,000), protect profits, and reduce new short positions. Aggressive traders may partially close positions. Future rebounds to R1 or R2 resistance levels accompanied by stalling/low-volume signals could be viewed as new shorting opportunities.
- • For Reversal/Swing Traders (Bullish): This is not the time for heavy bottom-fishing. Await the "Secondary Test" signal.
- • Ideal Long Entry Conditions: Price retests the S1 (63,000) support zone and exhibits "low-volume stabilization" (volume significantly lower than February 5) or a "high-volume rebound" candlestick signal. This would present a high reward-to-risk trial long opportunity.
- • Initial Entry Zone:64,500 (set stop-loss below $61,500).
- • Initial Target Zones: R1 (72,500).
- • For Observers: It is recommended to wait patiently. The key validation point is the outcome of the price's "Secondary Test" of the S1 support. If the test is successful (low-volume without making new lows or a quick recovery), the probability of a bottom increases significantly. If the test fails (high-volume break below S1), the downtrend will likely continue, targeting S2.
- 3. Future Validation Points (Require Close Monitoring):
- 1. Volume behavior when price retests the63,000 zone. (Low volume is preferred, verifying supply exhaustion).
- 2. Whether price can break above and hold above $70,000 (R1) on significant volume. (Confirming the strength of demand recovery).
- 3. Whether short-term volatility (
HIS_VOLA_7D) can continue to decline below 60%. (Indicating stabilizing market sentiment).
Disclaimer: All content in this report is derived from the provided historical data and quantitative model analysis, intended for reference and research purposes only. It does not constitute any specific investment advice. Markets involve risks; invest with caution.
Thank you for your attention! Wyckoff volume-price market analysis is released daily at 8:00 before the market opens. Please feel free to comment and share. Your recognition is crucial. Let's continue to navigate the markets with insight.
Member discussion: